Data Visualization
Raw dashboards often fail because they present too much information without context. Data visualization at Practonovate is not just about placing charts on a screen—it is a visual design discipline focused on cognitive speed, clarity, and decision science. We design interfaces that help executive and operational teams spot anomalies, identify growth drivers, and act instantly.
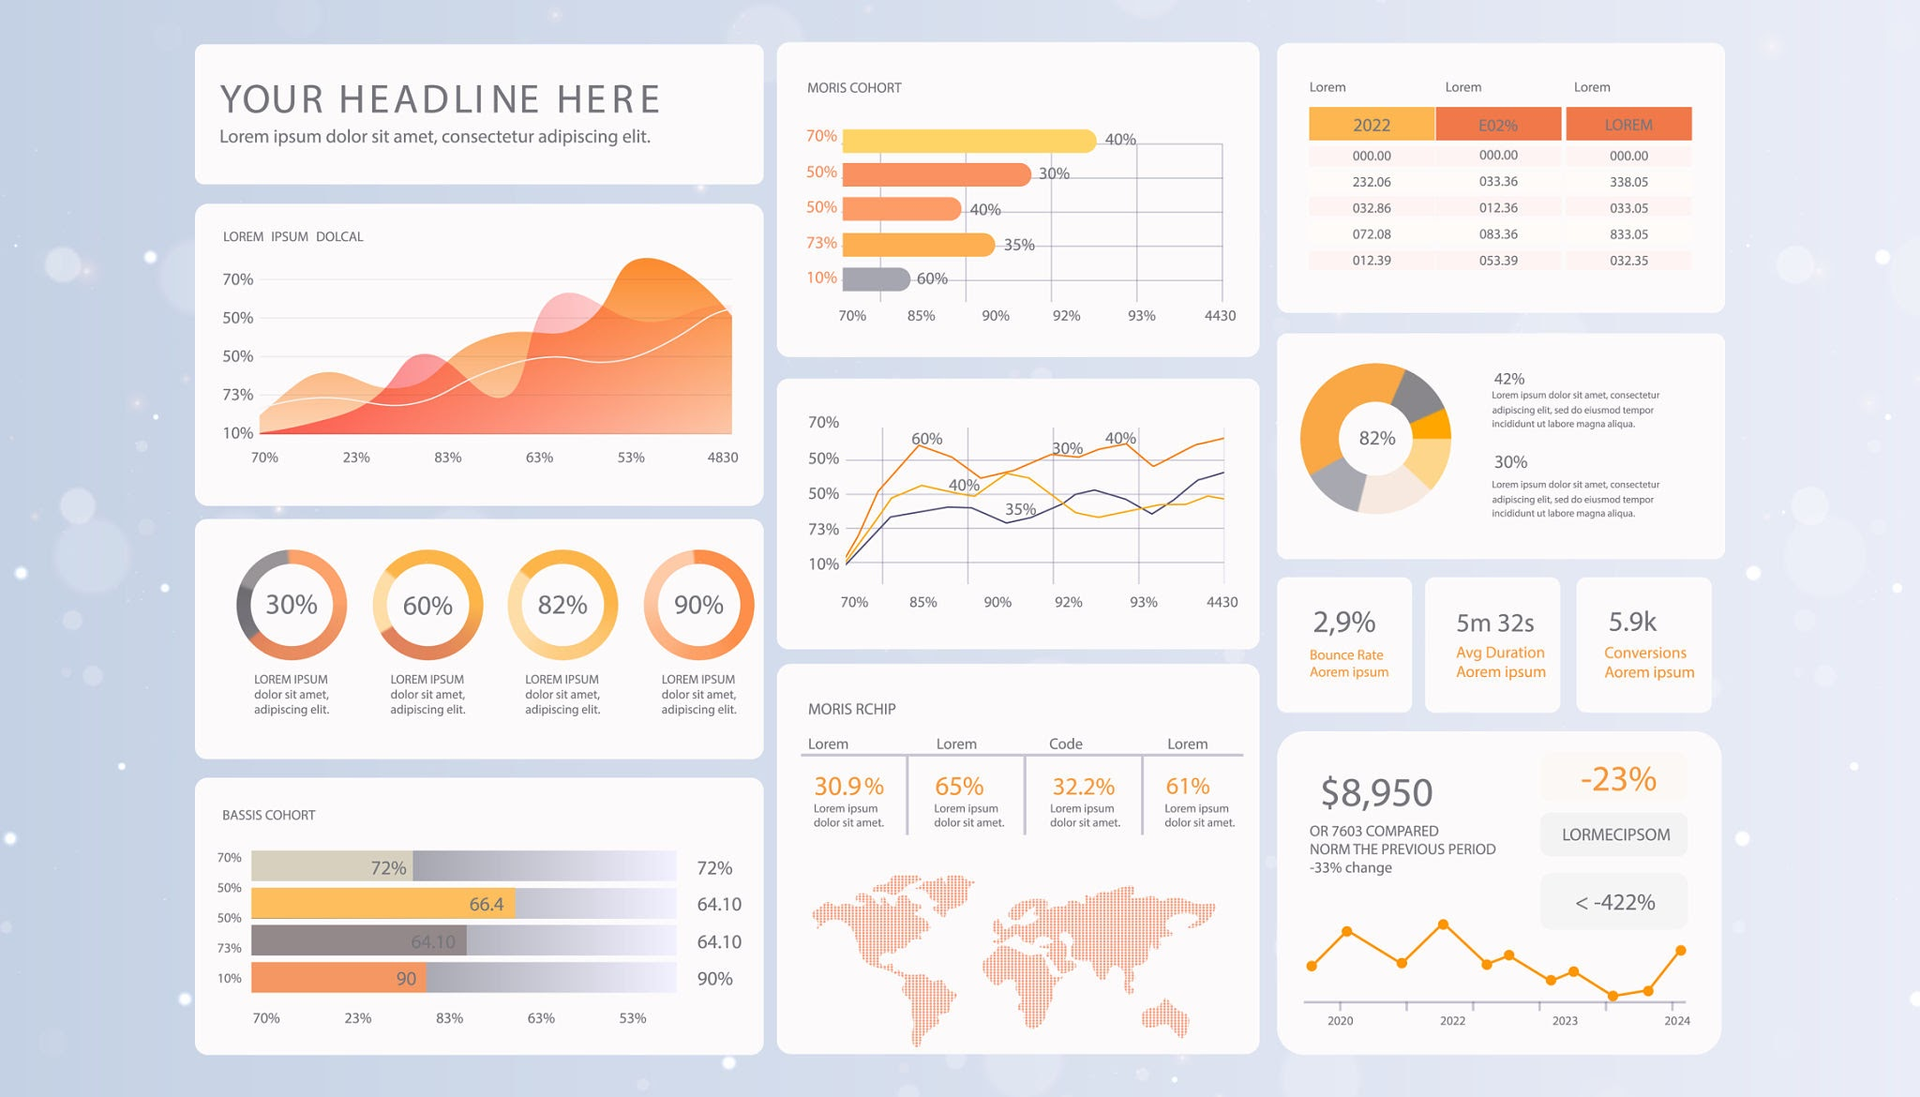
Design & Engineering Standards
Role-Based UI/UX Design:
We design distinct visual environments for different organizational roles—high-level summaries for the C-suite and high-density, granular viewports for operational managers.
Information Hierarchy & Visual Noise Reduction:
We employ strict visual hierarchy, contextual tooltips, and deliberate color-coding so users focus on critical deviations rather than chart noise.
Responsive & Cross-Platform UI:
Whether accessed on a desktop workstation, an executive tablet, or a mobile device, our visualizations dynamically reshape for optimal legibility.
Real-Time Visual Triggers:
Color-coded alert thresholds change dynamically when metrics fall out of bounds, notifying teams to immediate operational risks.
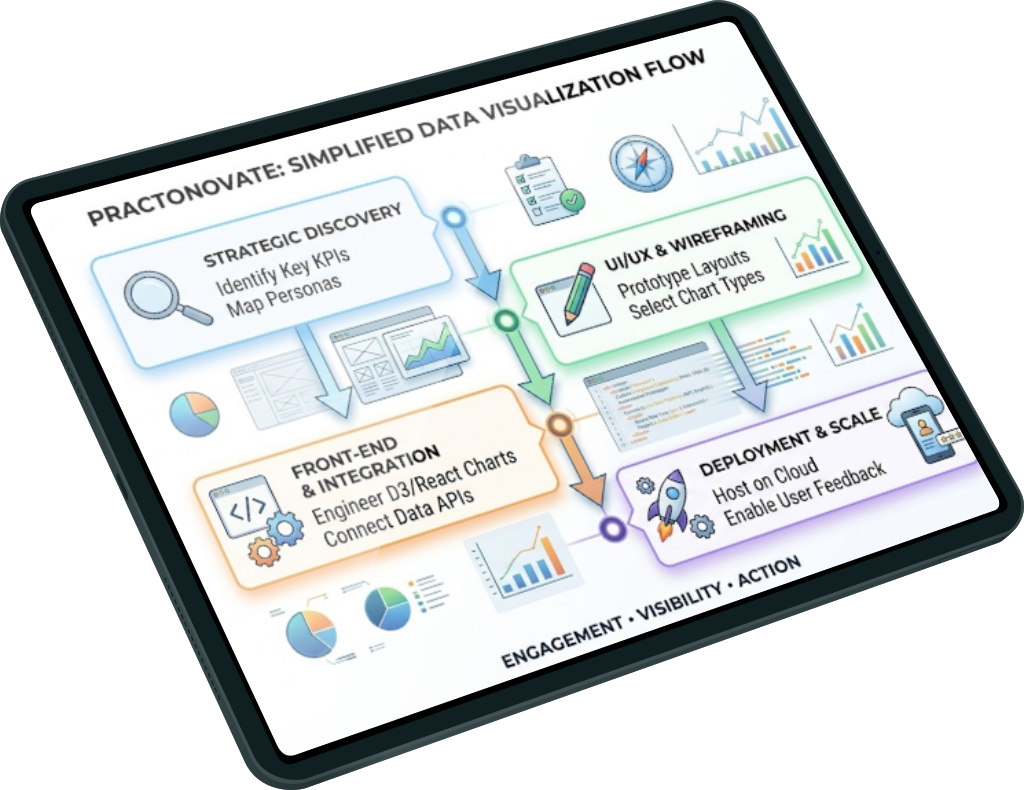
Tools we use
At Practonovate, we implement enterprise-grade BI environments powered by Microsoft Power BI, Tableau, Google Looker, and Qlik. Whether you need real-time operational marketing insights, interactive financial dashboards, or self-service analytics frameworks, our team builds the visual interfaces required to give your leadership total operational clarity.
- Microsoft Power BI:
A cost-effective enterprise analytics platform that transforms raw data into real-time, interactive dashboards across Microsoft ecosystems. - Tableau:
A premier visual analytics tool designed for high-performance visual storytelling and complex, drag-and-drop data exploration. - Google Looker:
A modern Google Cloud platform that uses semantic modelling (LookML) to query live data directly inside cloud data warehouses. - Qlik: A flexible business intelligence platform powered by an associative engine that uncovers hidden data relationships traditional SQL tools miss.